|
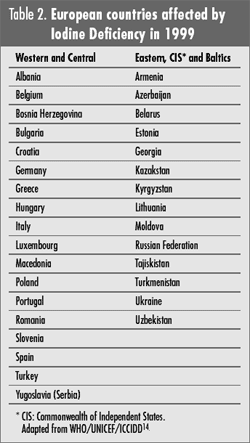
In 1999, WHO, UNICEF and ICCIDD reported that 18 countries in Western and Central
Europe and 14 countries in Eastern Europe were still affected by iodine deficiency14
(Table 2). But data from the literature indicate that three additional countries in
Western Europe, were also affected, namely Denmark15, France16 and Ireland17, which
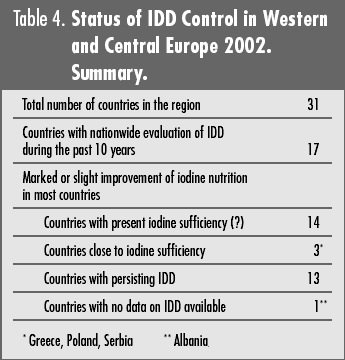
makes a total of 21 affected countries in this part of the continent. Control of IDD in these 35 countries has markedly improved even during the very recent years: 1. Western and Central Europe. Table 3 summarizes the results of the latest nationwide evaluations of the prevalence of goiter and of the concentrations of urinary iodine in Western and Central Europe. Such surveys were conducted in 17 of the former 21 iodine deficient countries. As recommended by WHO/UNICEF/ICCIDD9,10, most surveys were conducted in school-aged children (SAC). The prevalence of goiter was derived from measurements of thyroid volumes by ultrasound. Almost all urinary iodine assays were measured by using the colorimetric method of Sandell-Kolthoff18. Consequently, the results can be reasonably compared from one country to another. An interesting case is Denmark, the only country in which iodized salt was prohibited until 199915,19. Paradoxically, it was the high incidence of hyperthyroidism in the elderly (due to autonomous nodules in multinodular iodine deficiency goiters) that constituted the starting point for a very cautiously monitored program of salt iodization15. Germany was the first country to use a method of standardized evaluation of thyroid volume and prevalence of goiter by ultrasound20. This « ThyroMobil model » was further fitted for systematic collection of urine samples for iodine determination. It turned out to be one of the most efficient instruments for monitoring progress towards the elimination of IDD21. The Netherlands reached adequate iodine nutrition after phases of iodization of water and salt, especially for the bakery industry22. Belgium23 and France16 are among the very few European countries with no enforced programs of salt iodization so far and which remain similarly affected by mild iodine deficiency. Croatia, Macedonia, Poland and Turkey recorded substantial progress, especially after salt iodization was declared mandatory. In addition to the results of national surveys, local or regional studies on iodine nutrition showed spectacular progression towards iodine sufficiency in Greece24 but persistence of pockets of iodine deficiency in Portugal25 and Slovenia26. No data were available from Albania. In summary (Table 4), based on the data from the literature, it can be considered that in 2002, 14 of the 31 countries of Western and Central Europe have reached a normal status of iodine nutrition. These countries are Austria, Bulgaria, Croatia, Czech Republic, Finland, Germany, Iceland, Macedonia, The Netherlands, Norway, Slovakia, Sweden, Switzerland and the United Kingdom (Although the data from the UK do not conclusively show national iodine sufficiency)27. Another three countries, namely Greece, Poland and Serbia, are close to iodine sufficiency. IDD persist in 13 of other countries: Belgium, Bosnia, Denmark, France, Hungary, Ireland, Italy, Luxembourg, Portugal, Romania, Slovenia, Spain and Turkey. Finally, data are missing for Albania. Thus, the data indicate a spectacular progress in the control of IDD as within the last ten years, i.e. between 1992 and 2002, the number of countries with iodine sufficiency increased from 611 to 14 and possibly to 17. 2. Eastern Europe and Central Asia Doctor Gregory Gerasimov has very recently updated the information on IDD and their control through salt iodization in 15 countries of Eastern Europe and Central Asia, including 12 countries of the Commonwealth of Independent States (CIS) and the three Baltic States (BS) (Gerasimov, unpublished). This update is based not only on published reports but also on unpublished information, including country reports, data from agencies and personal communications. National IDD surveys were conducted in Armenia, Azerbaijan, Belarus and Uzbekistan. Regional surveys were conducted in Kazakhstan, Kyrgyzstan and Turkmenistan. A national baseline IDD survey is planned in Ukraine for 2002. These different surveys indicate that substantial progress has been made in the region in the evaluation of the IDD status, in expanded production, supply and use of iodized salt. Some countries such as Armenia and Turkmenistan are very close to virtual elimination of IDD. However the goal of IDD elimination by the year 2000 has not been reached and additional efforts are needed to combat iodine deficiency in this part of Europe.
|
|||||||||||||||||||||||||||||||||||||||||||||||||||||||||||||||||||||||||||||||||||||||||||||||||||||||||||||||||||||||||||||||||||||||||||||||||||||||||||||||||||||||||||||||||||||||||||||||||||||||||||||||||||||||||||||||||||||||||||||||||||||||||||||||||||||||||||||||||||||||||||||||||||||||||||||||||||||||||||||||